Northern Front Range Housing Market: The Mid-2026 Read
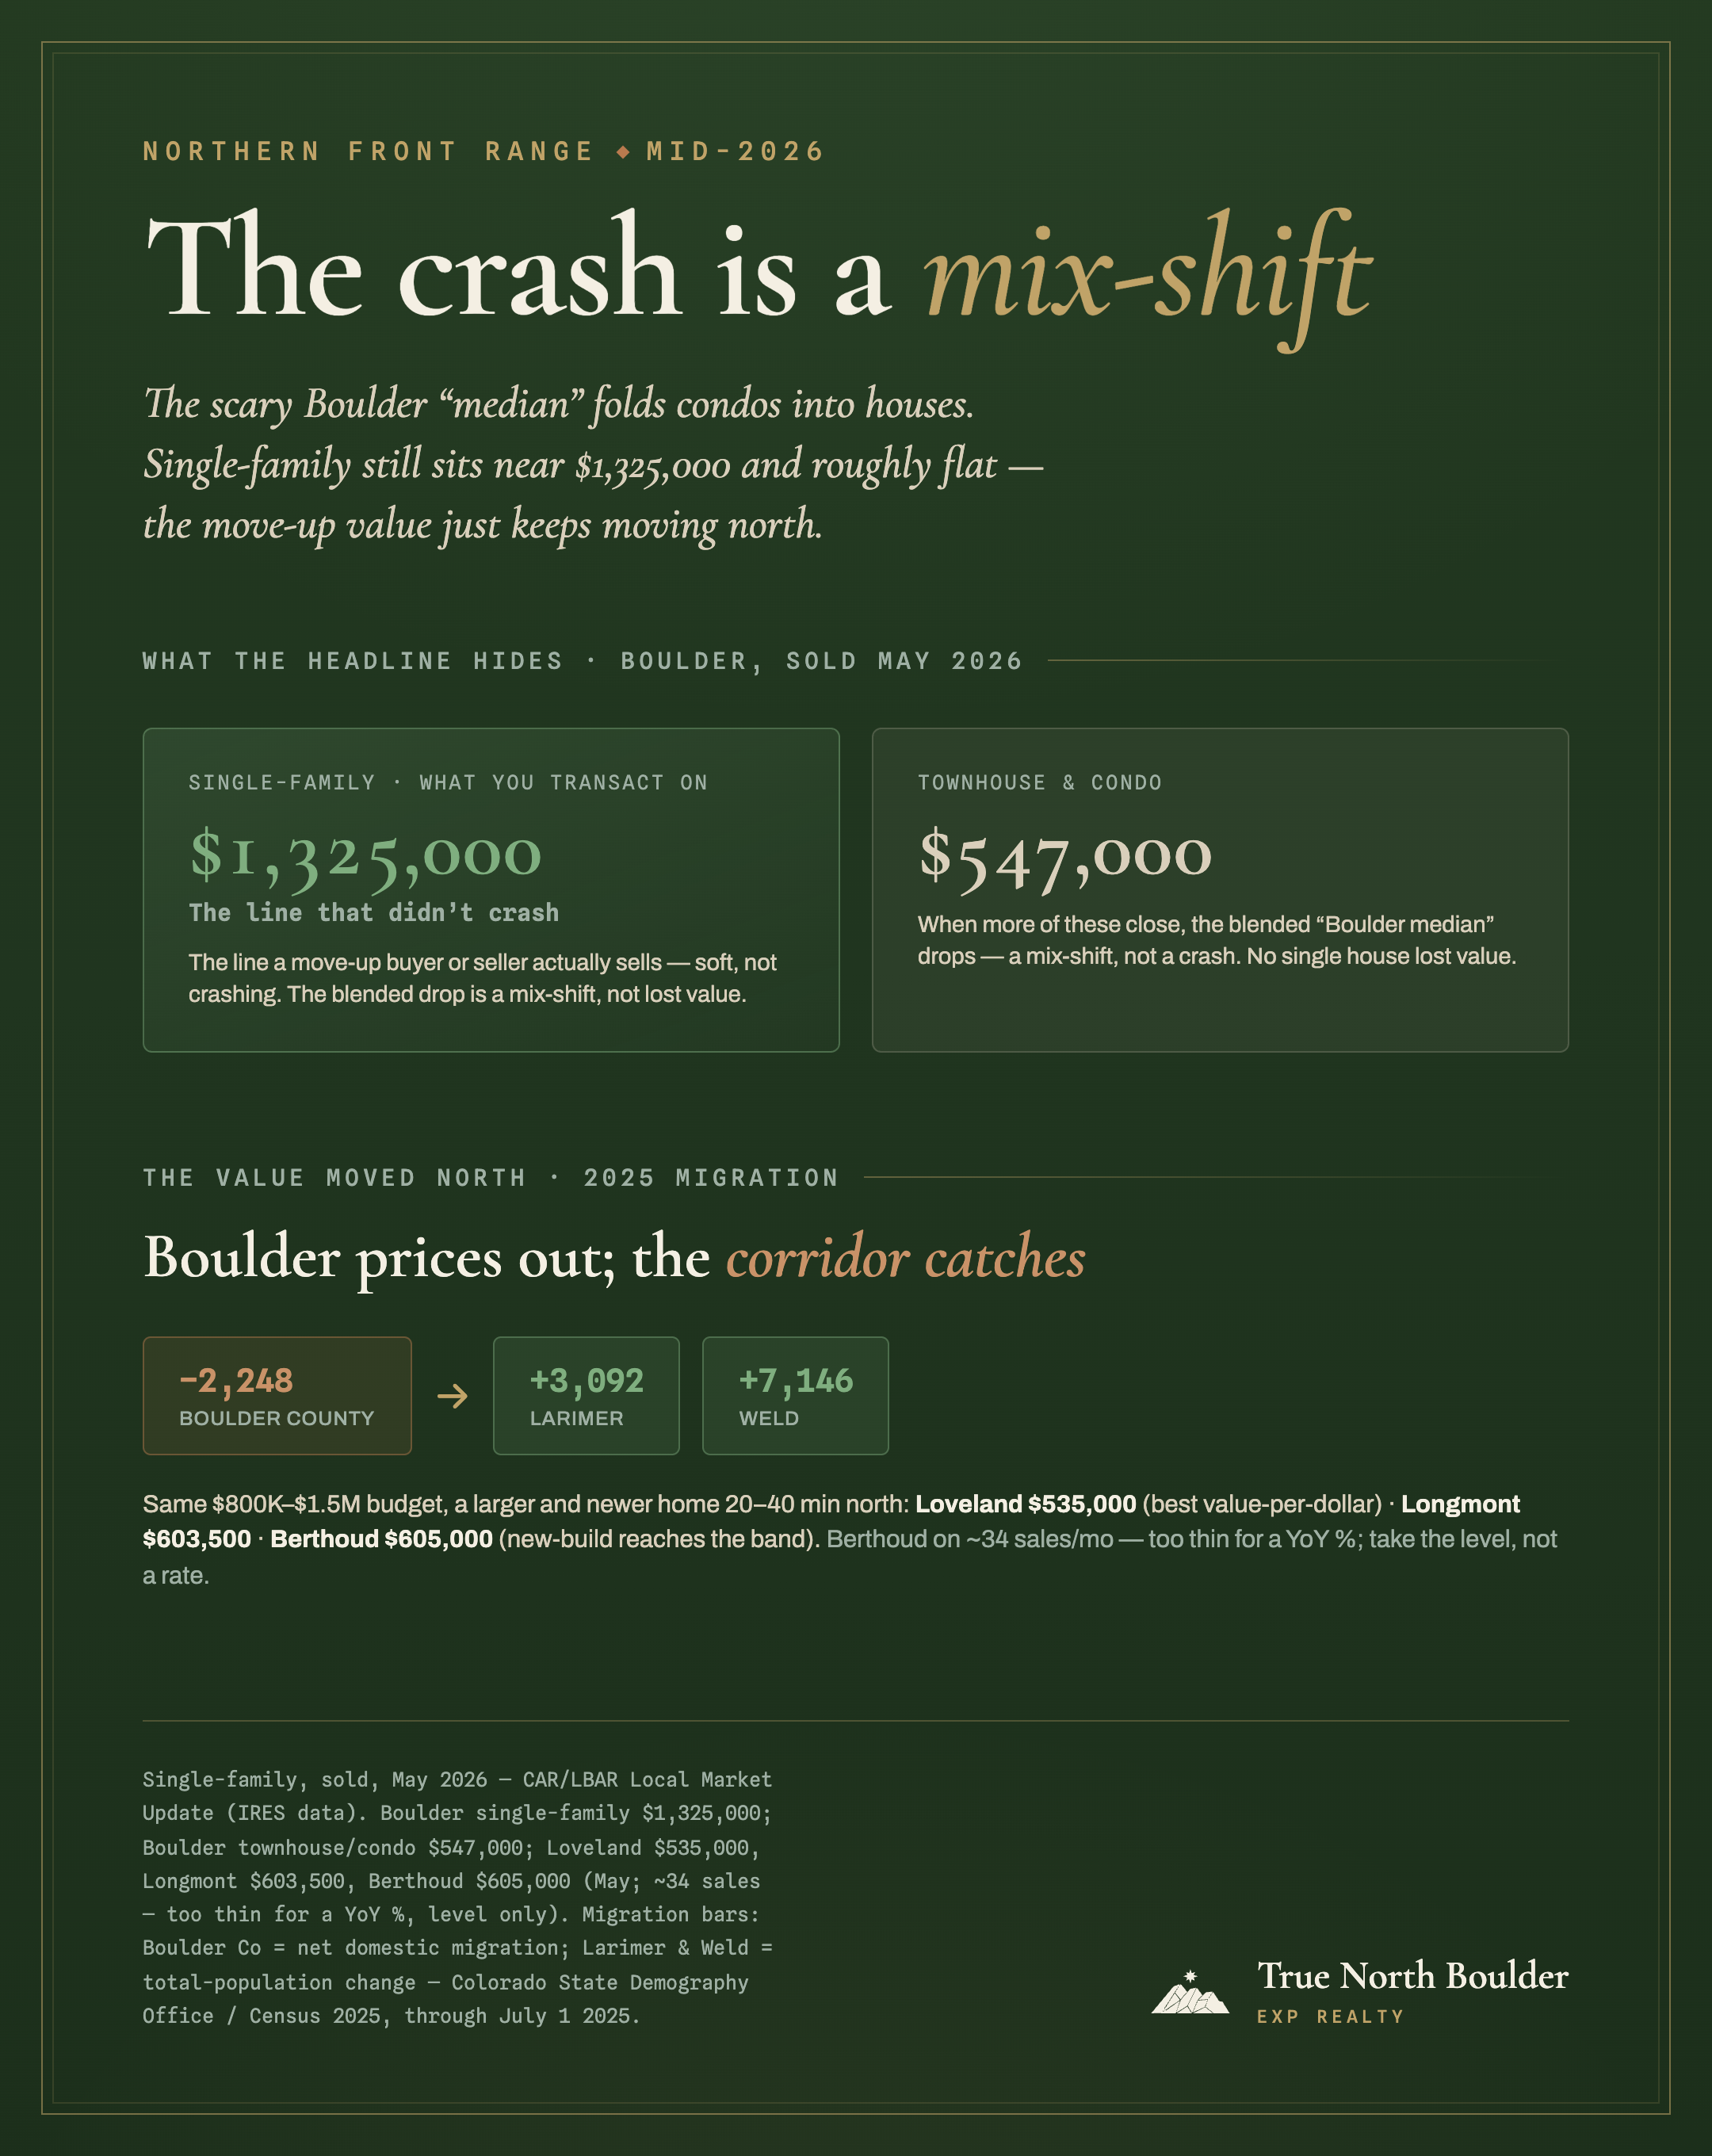
The scary Boulder 'median' is a condo mix-shift, not a crash: single-family still sits near $1,325,000 and roughly flat at mid-2026. Across the northern Front Range, the move-up value keeps moving north, where Larimer and Weld absorb the buyers Boulder County prices out.
Last updated: July 2026. Single-family and town figures come from the CAR Local Market Update (IRES data), May 2026. Context below is publicly sourced and dated. Earlier versions of this report cited public-portal figures on the wrong basis; those have been replaced when the feed connects.
Key takeaways
- A frightening-looking "Boulder median" is almost always a condo mix-shift. Single-family sits at $1,325,000, roughly flat year over year (CAR/IRES, May 2026).
- The move-up value keeps sliding north: Loveland near $535,000 is the best value-per-dollar in the band, and Berthoud, on 34 sales a month, is too small to read a reliable year-over-year rate from a single median, so we quote the $605,000 level, not a percentage.
- The 30-year fixed averaged 6.43% the week of July 2, 2026 (Freddie Mac), and statewide supply reached about 4.3 months, enough room to negotiate at a measured pace.
Across the northern Front Range housing market at mid-2026, single-family homes are holding rather than falling: Boulder's single-family median is $1,325,000, roughly flat rather than falling, and the move-up value keeps shifting north up the corridor. The headline you have probably seen, a Boulder "median" down double digits, is real in the data and misleading in the read. It blends condos and townhomes with houses, and this year the sales mix tilted toward smaller, cheaper units, which drags the blended figure down without any single house losing that value. This briefing ties the five towns together so you can see where the $800K–$1.5M move-up math actually works right now, instead of reacting to one scary number.
Did Boulder home prices actually fall in 2026?
No, not in the way the number suggests. Boulder's single-family median is $1,325,000, roughly flat rather than falling (CAR/IRES, May 2026). The blended, all-property median looks down because more condos and townhomes closed this year, a mix-shift, not falling house values.
The blend is easy to see once you split it. Boulder single-family closed at a median of $1,325,000 in May 2026; Boulder townhouses and condos closed at $547,000 (CAR Local Market Update, IRES data). Any single "Boulder median" you read is some weighted average of those two, and it moves when the mix of what sold moves, not evidence that a $1.1 million house is suddenly worth $900,000. When condos and townhomes make up a bigger share of closings, the middle of the stack drops even if every individual home holds its value. The single-family line, the one a move-up buyer or seller actually transacts on, has stayed close to flat.
Read those three together and the year makes sense: house values held, the cheapest money in a year arrived, and the headline still said the floor was falling out.
The honest take
"The median dropped, so the market crashed" is the most repeated mistake in Boulder this year. A double-digit fall in a blended median almost always means the sales mix changed, not that homes lost a fifth of their value. Boulder's single-family median is $1,325,000, roughly flat rather than falling, and the corridor towns are steady to higher, though Berthoud is the exception you should not read off a single month: its May median was $605,000 on just 34 sales, too thin to publish a reliable year-over-year rate, so we quote the level, not a percentage. At that volume, read the year, not the month. If you priced your move off the scary headline, you priced it off the wrong number.
Where does the northern Front Range housing market leave the move-up band?
Boulder anchors the top of the band and the corridor spreads out beneath it. Longmont's median is $603,500, Loveland's $535,000 (the best value-per-dollar in the band), and In-band $800K–$1.5M product exists in every town, but you buy a very different home for it depending on where you look.
The pattern is consistent: the further north you go, the more house, land, or newer construction your budget buys. Boulder's in-band money buys entry-to-mid single-family. The same figure in Longmont, Loveland, or Berthoud buys the upper tier of those towns, often newer and on a larger lot. School districts vary by town, so confirm boundaries per address: Boulder Valley (BVSD) covers Boulder and Gunbarrel, St. Vrain Valley (SVVSD) covers Longmont, Lyons, and Niwot, and Thompson R2-J covers Loveland and Berthoud.
| Town | Median | Days on market | Months supply | $800K–$1.5M band fit |
|---|---|---|---|---|
| Boulder | $1,325,000 | 60 | 4.7 | Entry-to-mid tier of Boulder single-family |
| Longmont | $603,500 | 55 | 2.6 | Upper tier; the tightest market in the corridor |
| Loveland | $535,000 | 61 | 2.7 | Upper tier; the only town whose median rose |
| Berthoud | $605,000 | 65 | 5.4 | Loosest in the footprint, and loosening; new-build reaches the band |
| Lyons | we don't publish one | — | ~5–7 sales/mo | Too thin for a monthly median; see the note below |
Why Lyons has no number. Lyons transacts in single digits most months. At that volume a median is one architect-built canyon property away from moving $200,000, and no authority publishes a figure for it — the REALTOR association's town reports simply don't include Lyons. You will find numbers for it online; this season alone the public sources spread from $849,900 to $1,195,000, and one of the most-quoted is an asking median, which measures what sellers hope for, not what anyone paid. We would rather tell you that than pick one. We would rather tell you that than pick one. If you need a reference point, the nearest published market is Longmont, twenty minutes east, at a $603,500 single-family median.
CAR Local Market Update (IRES data), single-family, sold, May 2026. Boulder is a single-family average and Lyons a list median; IRES pull pending. Refreshes to live IRES data.
Why is the move-up value shifting north up the corridor?
Because Boulder County is pricing people out and the corridor is catching them. Boulder County lost a net 2,248 residents to domestic migration, while Larimer and Weld were among the state's largest domestic-migration gainers (each roughly +2,000 or more) and grew by 3,092 and 7,146 in total population (Colorado State Demography Office / Census 2025 estimates, through July 1, 2025). The buyers leave; the value follows them north.
Colorado recorded net-negative domestic migration for the first time since 2004, and Boulder County was one of the larger local losers while Larimer and Weld posted the state's biggest gains (Colorado State Demography Office). Those are also the counties adding the most new homes, so the inflow has somewhere to land. For a move-up buyer the read is practical: the same budget that buys entry-level single-family in Boulder buys a larger, newer home 20 to 40 minutes north. That is why our corridor comparison of what $1M to $1.5M buys keeps pointing buyers to check the northern towns before assuming Boulder is the only option, and one line to verify first: newer corridor subdivisions can layer a metro-district mill levy that changes the true monthly cost.
What should a move-up buyer or seller do right now?
Anchor to your price band and your sequence, not the headline median. Buyers gained negotiating room in a balanced market, with the 30-year fixed averaged 6.43% the week of July 2, 2026, per Freddie Mac). Sellers can still move a well-priced, turnkey home, but the days of naming your number are behind us.
If you are buying, the corridor is where your money stretches, so decide on employer, commute, and school district first, then let price follow. Gunbarrel keeps a Boulder address inside BVSD at the lower end of the band, while the Gunbarrel guide and the town reads go deeper than this footprint view. If you are selling to move up, the real bind is sequencing, not staging: you are also buying, so the order you choose sets your price and your posture at the table. Coordinate it on purpose with the buy-before-you-sell playbook rather than letting the market pick the order for you. And if a specific town is on your shortlist, the monthly Longmont market report tracks that market in more detail than a footprint briefing can.
The bottom line
Single-family is stable, the median headline is a mirage, and the move-up value increasingly lives north. Where you buy matters more than when — as long as you price off the right number.
Sources & data notes
- Boulder and corridor market figures: Colorado Association of REALTORS Local Market Update, single-family, sold, May 2026, built on IRES MLS data and published free each month. Boulder: median $1,325,000, 60 days, 4.7 months of supply. Longmont: median $603,500, 55 days, 2.6 months.
- Boulder townhouse/condo median ($547,000): CAR Local Market Update (IRES data), May 2026. Carried only to show what a blended "Boulder median" folds in.
- Berthoud single-family median $605,000, on just 34 sales, too thin to publish a reliable year-over-year rate, so we quote the level, not a percentage (CAR Local Market Update, IRES data, May 2026). A widely-circulated portal figure shows Berthoud "up ~12%"; that is an all-property-types, three-month window, and the MLS contradicts it. At 34 sales a month, read the year, not the month.
- Statewide months of supply (~4.3), new listings (−14% YoY), median sale price (+2.7%): Colorado Association of REALTORS, May 2026
- Migration and population (Boulder County −2,248 domestic; Larimer +3,092, Weld +7,146 total): Colorado State Demography Office / Census 2025 estimates, through July 1, 2025
- 30-year fixed rate (6.43%, week of July 2, 2026): Freddie Mac PMMS; a national survey average, not a quoted rate
Frequently asked
Did Boulder home prices fall in 2026?+
Not in the way the headline suggests. Boulder single-family carries a median of $1,325,000, roughly flat against last year (CAR Local Market Update, IRES data, May 2026). Any blended, all-property median looks far worse, because it folds Boulder's $547,000 townhouse and condo market into the same figure. When more condos close, that blended middle drops without a single house losing value without any individual house losing that value.; that is a mix-shift, not a crash.
What is the northern Front Range housing market doing at mid-2026?+
It is steady, not falling. Single-family values are roughly flat in Boulder and steady to higher up the corridor, though Berthoud is the exception you should not read off a single month: its May median was $605,000 on just 34 sales, too thin to publish a reliable year-over-year rate, so we quote the level, not a percentage. At that volume, read the year, not the month. Inventory has loosened and the 30-year fixed rate averaged 6.43% the week of July 2, 2026 (Freddie Mac), so buyers can negotiate at a measured pace instead of racing the clock.
Where is the best move-up value in the northern Front Range right now?+
For the $800K–$1.5M band, the corridor towns north of Boulder stretch your budget furthest. Loveland offers the best value-per-dollar at a $535,000 median, Longmont sits at $603,500, and Berthoud at $605,000 layers in new construction that can reach $800K–$1.2M. The same budget buys a larger, newer home 20 to 40 minutes north of Boulder.
Is it a buyer's or a seller's market across the corridor?+
Roughly balanced, tilting toward buyers at the margins. Statewide months of supply sat at about 4.3 in May 2026, edging up toward the balanced range as inventory recovered, with new listings down roughly 14% year over year and the median sale price up about 2.7% (Colorado Association of REALTORS, May 2026). That balance is a footprint average. Town supply runs tighter, with Boulder at 4.7 months and Longmont at 2.6. Turnkey, well-priced homes still move, sometimes with competition, while dated or over-priced homes sit. The balance is enough that timing a sale and purchase together is a plan you can run, not a coin flip.
Why is Boulder County losing residents while Larimer and Weld grow?+
Price. Boulder County lost a net 2,248 residents to domestic migration, while Larimer and Weld were among the state's largest domestic-migration gainers (each roughly +2,000 or more) and grew by 3,092 and 7,146 in total population (Colorado State Demography Office / Census 2025 estimates, through July 1, 2025). Those two corridor counties are also adding the most new homes in the region, so the buyers Boulder prices out have somewhere north to land.
What mortgage rate should a move-up buyer expect in mid-2026?+
The 30-year fixed averaged 6.43% the week of July 2, 2026, down from 6.49% the prior week and 6.67% a year earlier (Freddie Mac PMMS). Rates sat at a seven-week low. The move-up band is less rate-sensitive than entry-level, but the softer rate plus looser inventory is why buyers have more room to negotiate this summer than they did a year ago. Verify the current figure before you lock.
Want the corridor read for your budget?
Tell us your price band and timeline, and we will map where it stretches furthest across the footprint. No obligation.
See also: the corridor comparison of what $1M–$1.5M buys · the buy-before-you-sell playbook · the monthly Longmont market report. External references: Freddie Mac Primary Mortgage Market Survey · Colorado State Demography Office (DOLA) · Colorado Association of REALTORS — May 2026 market report · Redfin Boulder housing market.
Daniel Hsieh is a licensed Colorado real estate broker with True North Boulder, brokered by eXp Realty. Figures here come from the CAR Local Market Update (IRES data), May 2026 (see the source box) and swap to live IRES data as the feed connects; verify any number against current IRES or county data before acting. This briefing is market information, not a promise of any specific price, timeline, or outcome.