Loveland Housing Market Report (Updated Monthly)
Loveland is the corridor's outlier: single-family supply at just 2.7 months, the corridor's tightest, and a median that rose about 1.5% year to date while the rest of the corridor softened on price. Here's what the town numbers show, and why the move-up band above the median behaves differently.
Last updated: July 2026. Figures are single-family sold data for the city of Loveland, from the Colorado Association of REALTORS Local Market Update (data from IRES, the Front Range MLS): the latest release is May 2026 (the June update publishes in late July).
Loveland is the corridor outlier: single-family supply tightened to 2.7 months from 3.4 a year ago, and the median rose about 1.5% year to date, to $525,000 (CAR/IRES, May 2026). While Boulder and Longmont both softened on price, Loveland tightened and appreciated. That's the headline. The footnote that matters more for a move-up buyer: the $800K–$1.5M band trades well above Loveland's $535,000 median, in the upper tail of the distribution, so the town figure tells you Loveland is affordable and busy, not what your band actually costs.
What's the Loveland median right now?
Loveland single-family closed at a median of $535,000 in May 2026, and $525,000 year to date, about 1.5% above the same stretch last year. Lead with the year-to-date figure; a single month here rests on 126 sales and swings. The average, $618,592, sits well above the median, which tells you the upper end (the west-side foothills and lakeshore stock) pulls the top of the market up.
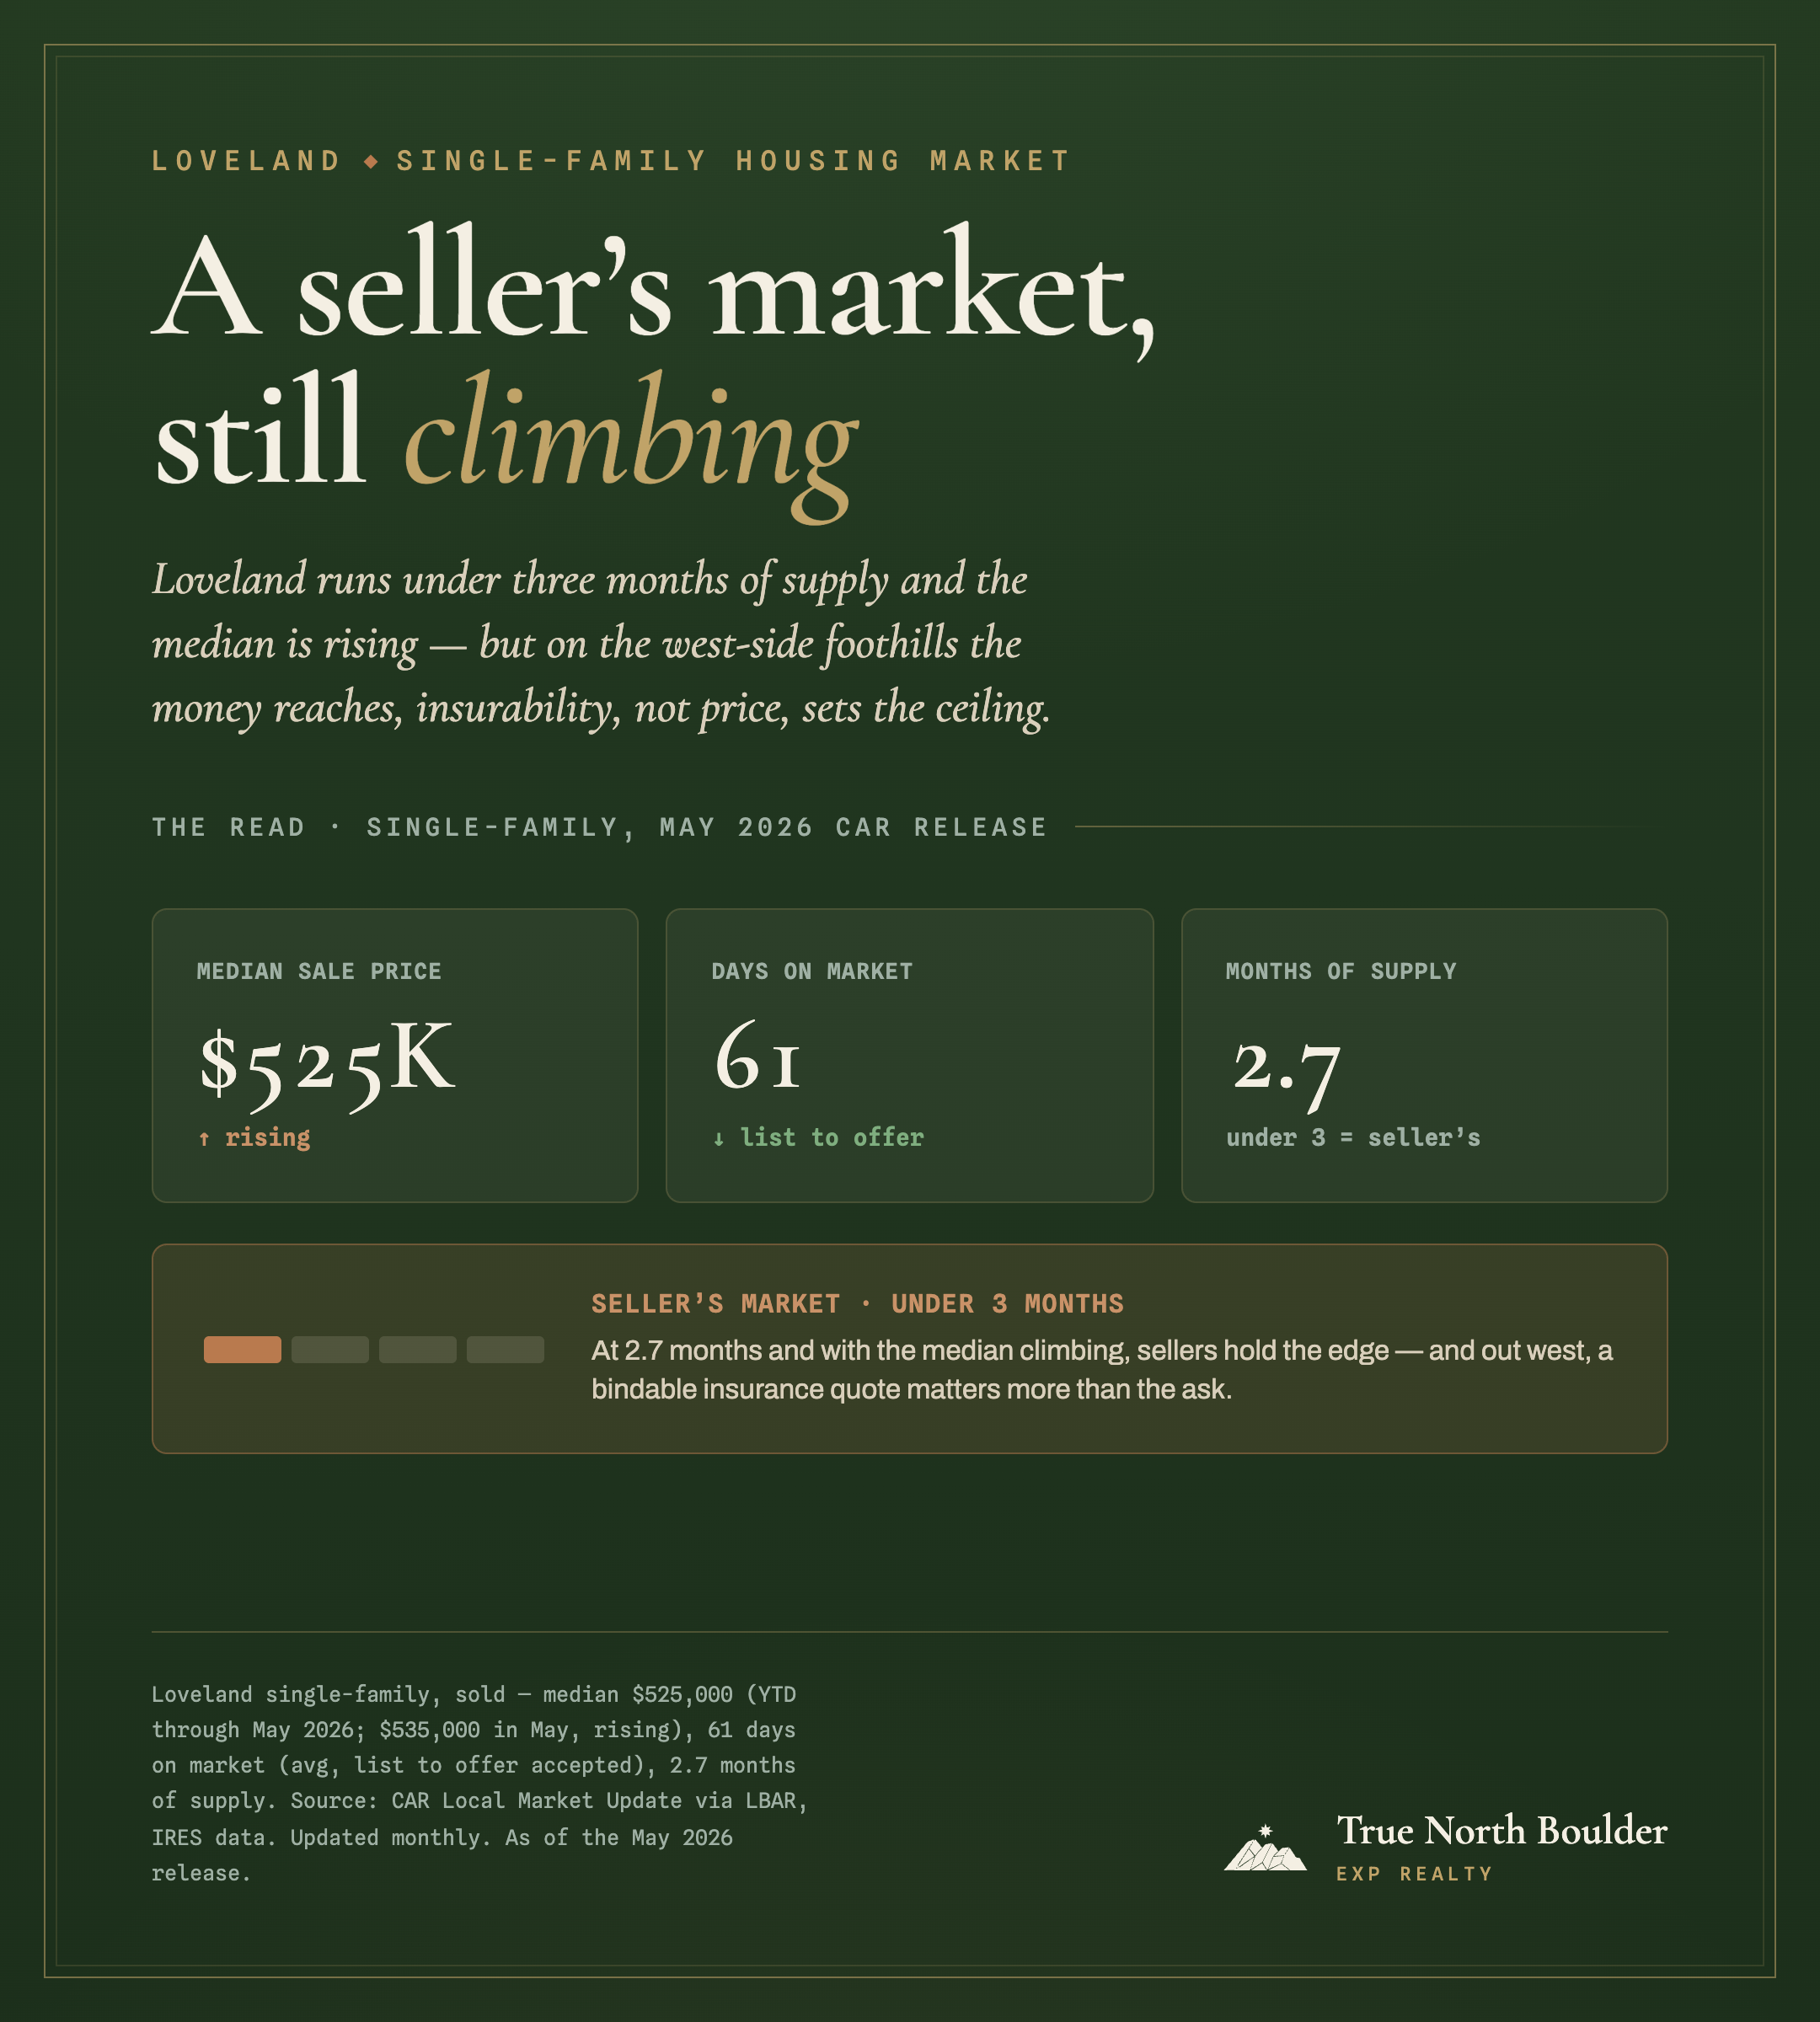
Read those figures the way we compile them: single-family, sold, city of Loveland, and note the one number we deliberately won't publish.
The town median sits below your band
Every figure here is single-family, sold, for the city of Loveland, from the Colorado Association of REALTORS Local Market Update, built on IRES MLS data and published free each month. Medians and averages exclude seller concessions.
We won't publish a months-of-supply figure for the $800K–$1.5M band. Half of Loveland's single-family sales close below $535,000, so a move-up buyer shops the upper tail of the town's distribution, where inventory is thinner, homes are more distinctive, and the market is likely slower and choosier than the busy 2.7-month town aggregate suggests. No public source breaks the band out; it takes a direct IRES pull. If you're transacting in that band, ask us to pull yours; a band-level read on the upper-tail inventory your own search faces beats a town aggregate that was never about your house.
Why did Loveland go up when the corridor went down?
Because tightness and price direction are different variables, and Loveland happens to be tight in both. Boulder is down about 5% year to date and Longmont about 4.8%, on completely different housing stock; Loveland is up about 1.5%. All three are clearing quickly; Boulder is the only one over three months of supply. Tightness tells you how fast the market clears; it doesn't dictate which way the median moves, and in Loveland both point the same way this year.
Still, hold the same line we hold everywhere. Up 1.5% is the price of what sold, not proof that a given home is worth 1.5% more. A town median moves with the mix of what traded. For value versus mix, the FHFA publishes a quarterly repeat-sales index for the Fort Collins/Loveland area, which follows the same homes over time. And one number you'll see quoted, homes sold at about 99.8% of list price in May, is measured against the last list price, after any reductions, and excludes seller concessions, so it's evidence that homes which sell close near their final ask, not that every list holds.
Is Loveland a buyer's or a seller's market?
A seller's market by the conventional measure, and the corridor's tightest single-family market alongside Longmont. Loveland supply is 2.7 months, down from 3.4 a year ago; under roughly three months favors sellers. Boulder, by contrast, sits at 4.7.
| Single-family, May 2026 | Loveland | Longmont | Boulder |
|---|---|---|---|
| Median sale price | $535,000 | $603,500 | $1,325,000 |
| Months of supply | 2.7 (from 3.4) | 2.6 | 4.7 |
| Days on market | 61 | 55 | 60 |
| Median YTD, year-over-year | +1.5% | −4.8% | −5% |
Colorado Association of REALTORS Local Market Updates; data from IRES, single-family, May 2026. Town-level figures, not band-level.
For a move-up buyer, the corridor trade matters: selling in Boulder to buy in Loveland means selling into the looser market (4.7 months) and buying into the tighter one (2.7), the harder direction. The money has to be settled before you write. We work the financing in bridge loan vs. sale contingency and the sequencing in the buy-before-you-sell playbook.
In Loveland's move-up band, insurance is the number the median hides
The west-side foothills, canyon-mouth, and Lake Loveland stock a move-up dollar reaches is the same ground that carries wildfire and flood exposure, and on those homes insurability (whether a carrier will bind coverage, and at what cost) can decide the deal before price does. A newer east-side home in a metropolitan district trades that hazard premium for a metro-district mill levy on the tax bill instead. Neither shows up in a town median. Price both the insurance and the mills for the specific parcel before you fall for it; the Loveland market and neighborhood hub walks through how.
The honest take
Loveland reads like the easy corridor story this year (tight and going up while its neighbors soften), and that's true at the town level. But the town level isn't your level. The move-up dollar in Loveland lands on the west side, in the upper tail above the $535,000 median, where the market is thinner and choosier than 2.7 months suggests, and where insurability, not price, is the constraint that actually ends deals. So take the good news for what it is: Loveland is a genuinely healthy, affordable-by-corridor-standards market with real momentum. Just don't shop it off the town median, and don't fall for a foothills house before you've priced the insurance on it.
We won't publish a band number. We will build your comp set.
A comp set at your price and your product, not a town average; on the west side, the insurance picture too. That's the honest answer to what a Loveland home is worth.
Frequently asked
What is the median home price in Loveland?+
Loveland's single-family median sale price was $535,000 in May 2026, and $525,000 year to date, up about 1.5% from the same stretch last year (Colorado Association of REALTORS Local Market Update, data from IRES, May 2026). That is the single-family figure a move-up buyer transacts on. Loveland townhomes and condos are a separate market. The $800K–$1.5M move-up band trades well above the town median, in the upper tail of Loveland's distribution, so the town figure understates what that band costs.
Is the Loveland housing market a buyer's or a seller's market?+
A seller's market by the standard measure, and tighter than Boulder. Loveland single-family carries 2.7 months of supply, down from 3.4 a year ago (CAR/IRES, May 2026), and under roughly three months is read as favoring sellers. It's the corridor's tightest single-family market alongside Longmont, and homes sold at about 99.8% of last list price in May, very close to ask.
Are Loveland home prices going up or down?+
Up, modestly, on the year-to-date figure: Loveland's single-family median is about 1.5% higher year to date, to $525,000, and the May month was up about 3.1% (CAR/IRES, May 2026). That makes Loveland the corridor outlier: Boulder and Longmont are both down year to date. But a town median tracks the price of what sold, not the value of any one home; for value versus mix, the FHFA repeat-sales index for the Fort Collins/Loveland area is the honest instrument.
Why is insurance such a big factor in Loveland's move-up market?+
Because the west-side foothills, canyon-mouth, and lakeshore stock a move-up dollar reaches in Loveland carries wildfire and flood exposure, and on those homes insurability (whether you can bind coverage, and at what cost) can decide the deal before price does. It doesn't show up in a median. We cover the parcel-level insurance question in the Loveland market and neighborhood hub.
How often is this report updated?+
Monthly, at this same URL, with a refreshed last-updated date. The figures come from the Colorado Association of REALTORS Local Market Update for Loveland, built on IRES MLS data and published roughly four weeks after month end.
Sources & data notes
- All Loveland, Longmont and Boulder figures: Colorado Association of REALTORS Local Market Update, single-family, sold, May 2026 (and year-to-date through May), published free each month by the Loveland-Berthoud Association of REALTORS, built on IRES MLS data. Loveland · Longmont · Boulder. Loveland: median $535,000 (month, +3.1%) / $525,000 YTD (+1.5%); average $618,592; 61 days; 2.7 months of supply (from 3.4); 126 sales in May; 99.8% of last list price.
- Basis matters. These are single-family figures. Loveland townhome/condo is a separate market; any blended "Loveland median" mixes the two. Medians, averages, and percent-of-list exclude seller concessions.
- "Percent of list price received" (99.8%) is measured against the last list price, after any reductions, not the original. It is not evidence that prices are holding.
- Days on market is an average from listing to accepted offer, not to closing. Months of supply is inventory divided by trailing-twelve-month average pending sales (ShowingTime); under roughly three favors sellers.
- Single-month figures are noisy (126 Loveland single-family sales in May); we lead with year-to-date.
- Insurability on Loveland's west-side foothills/lake stock (wildfire + the 2013-remapped Big Thompson floodplain) and the metro-district mill levy on east-side master-planned homes are parcel-level costs a town median cannot show; see the Loveland hub.
- What we do not publish: a months-of-supply or median figure for the $800K–$1.5M band. No public source breaks it out; a direct IRES broker pull is required.
- A repeat-sales index separates value from mix. The FHFA House Price Index publishes one quarterly for the Fort Collins/Loveland metro area.
Get the monthly Loveland read.
Real MLS numbers, and the basis they're actually measured on, about once a month. Unsubscribe any time; see our privacy policy.
See also: the Loveland market and neighborhood hub · the buy-before-you-sell playbook · bridge loan vs. sale contingency · what a move-up budget buys across the corridor. External: CAR Local Market Update: Loveland (IRES data) · Larimer County Assessor.
Daniel Hsieh is a licensed Colorado real estate broker with True North Boulder, brokered by eXp Realty. Market figures are month-old MLS data and are not a valuation of any specific home; verify any number against current IRES or county data before acting. This report is general market information, not lending, tax, or legal advice. Confirm your specifics with your lender, CPA, or attorney.