Boulder Housing Market Report (Updated Monthly)
Boulder's single-family median is $1,325,000, and supply tightened from 6.4 months to 4.7. But that median isn't your price: the $800K–$1.5M move-up band straddles it, and the luxury tail above behaves nothing like the middle. What the town numbers do and don't tell you.
Last updated: July 2026. Figures are single-family sold data for the city of Boulder, from the Colorado Association of REALTORS Local Market Update (data from IRES, the Front Range MLS): the latest release is May 2026 (the June update publishes in late July).
Boulder's single-family median was $1,325,000 in May 2026, $1,300,000 year to date, and supply has tightened from 6.4 months a year ago to 4.7 (CAR/IRES, May 2026). Two things follow that most coverage skips. First, that median is the middle of the whole town, and the $800K–$1.5M move-up band straddles it. Much of it sits at or below the $1,325,000 median, with the top in the luxury tail above. Second, "down about 5% year to date" is a statement about the price of what sold, not about what your house is worth. Both matter, and this report is about the gap between the town number and your number.
What's the Boulder median right now?
Boulder single-family closed at a median of $1,325,000 in May 2026, and $1,300,000 year to date, about 5% below the same stretch last year. Hold the year-to-date figure, not the month. A single month here rests on 86 sales, and on a $1.3M market a handful of high-end or entry closings move the median by tens of thousands of dollars. The average tells you how skewed it is: $1,592,974 in May, far above the median, which is the signature of a long luxury tail pulling the top.
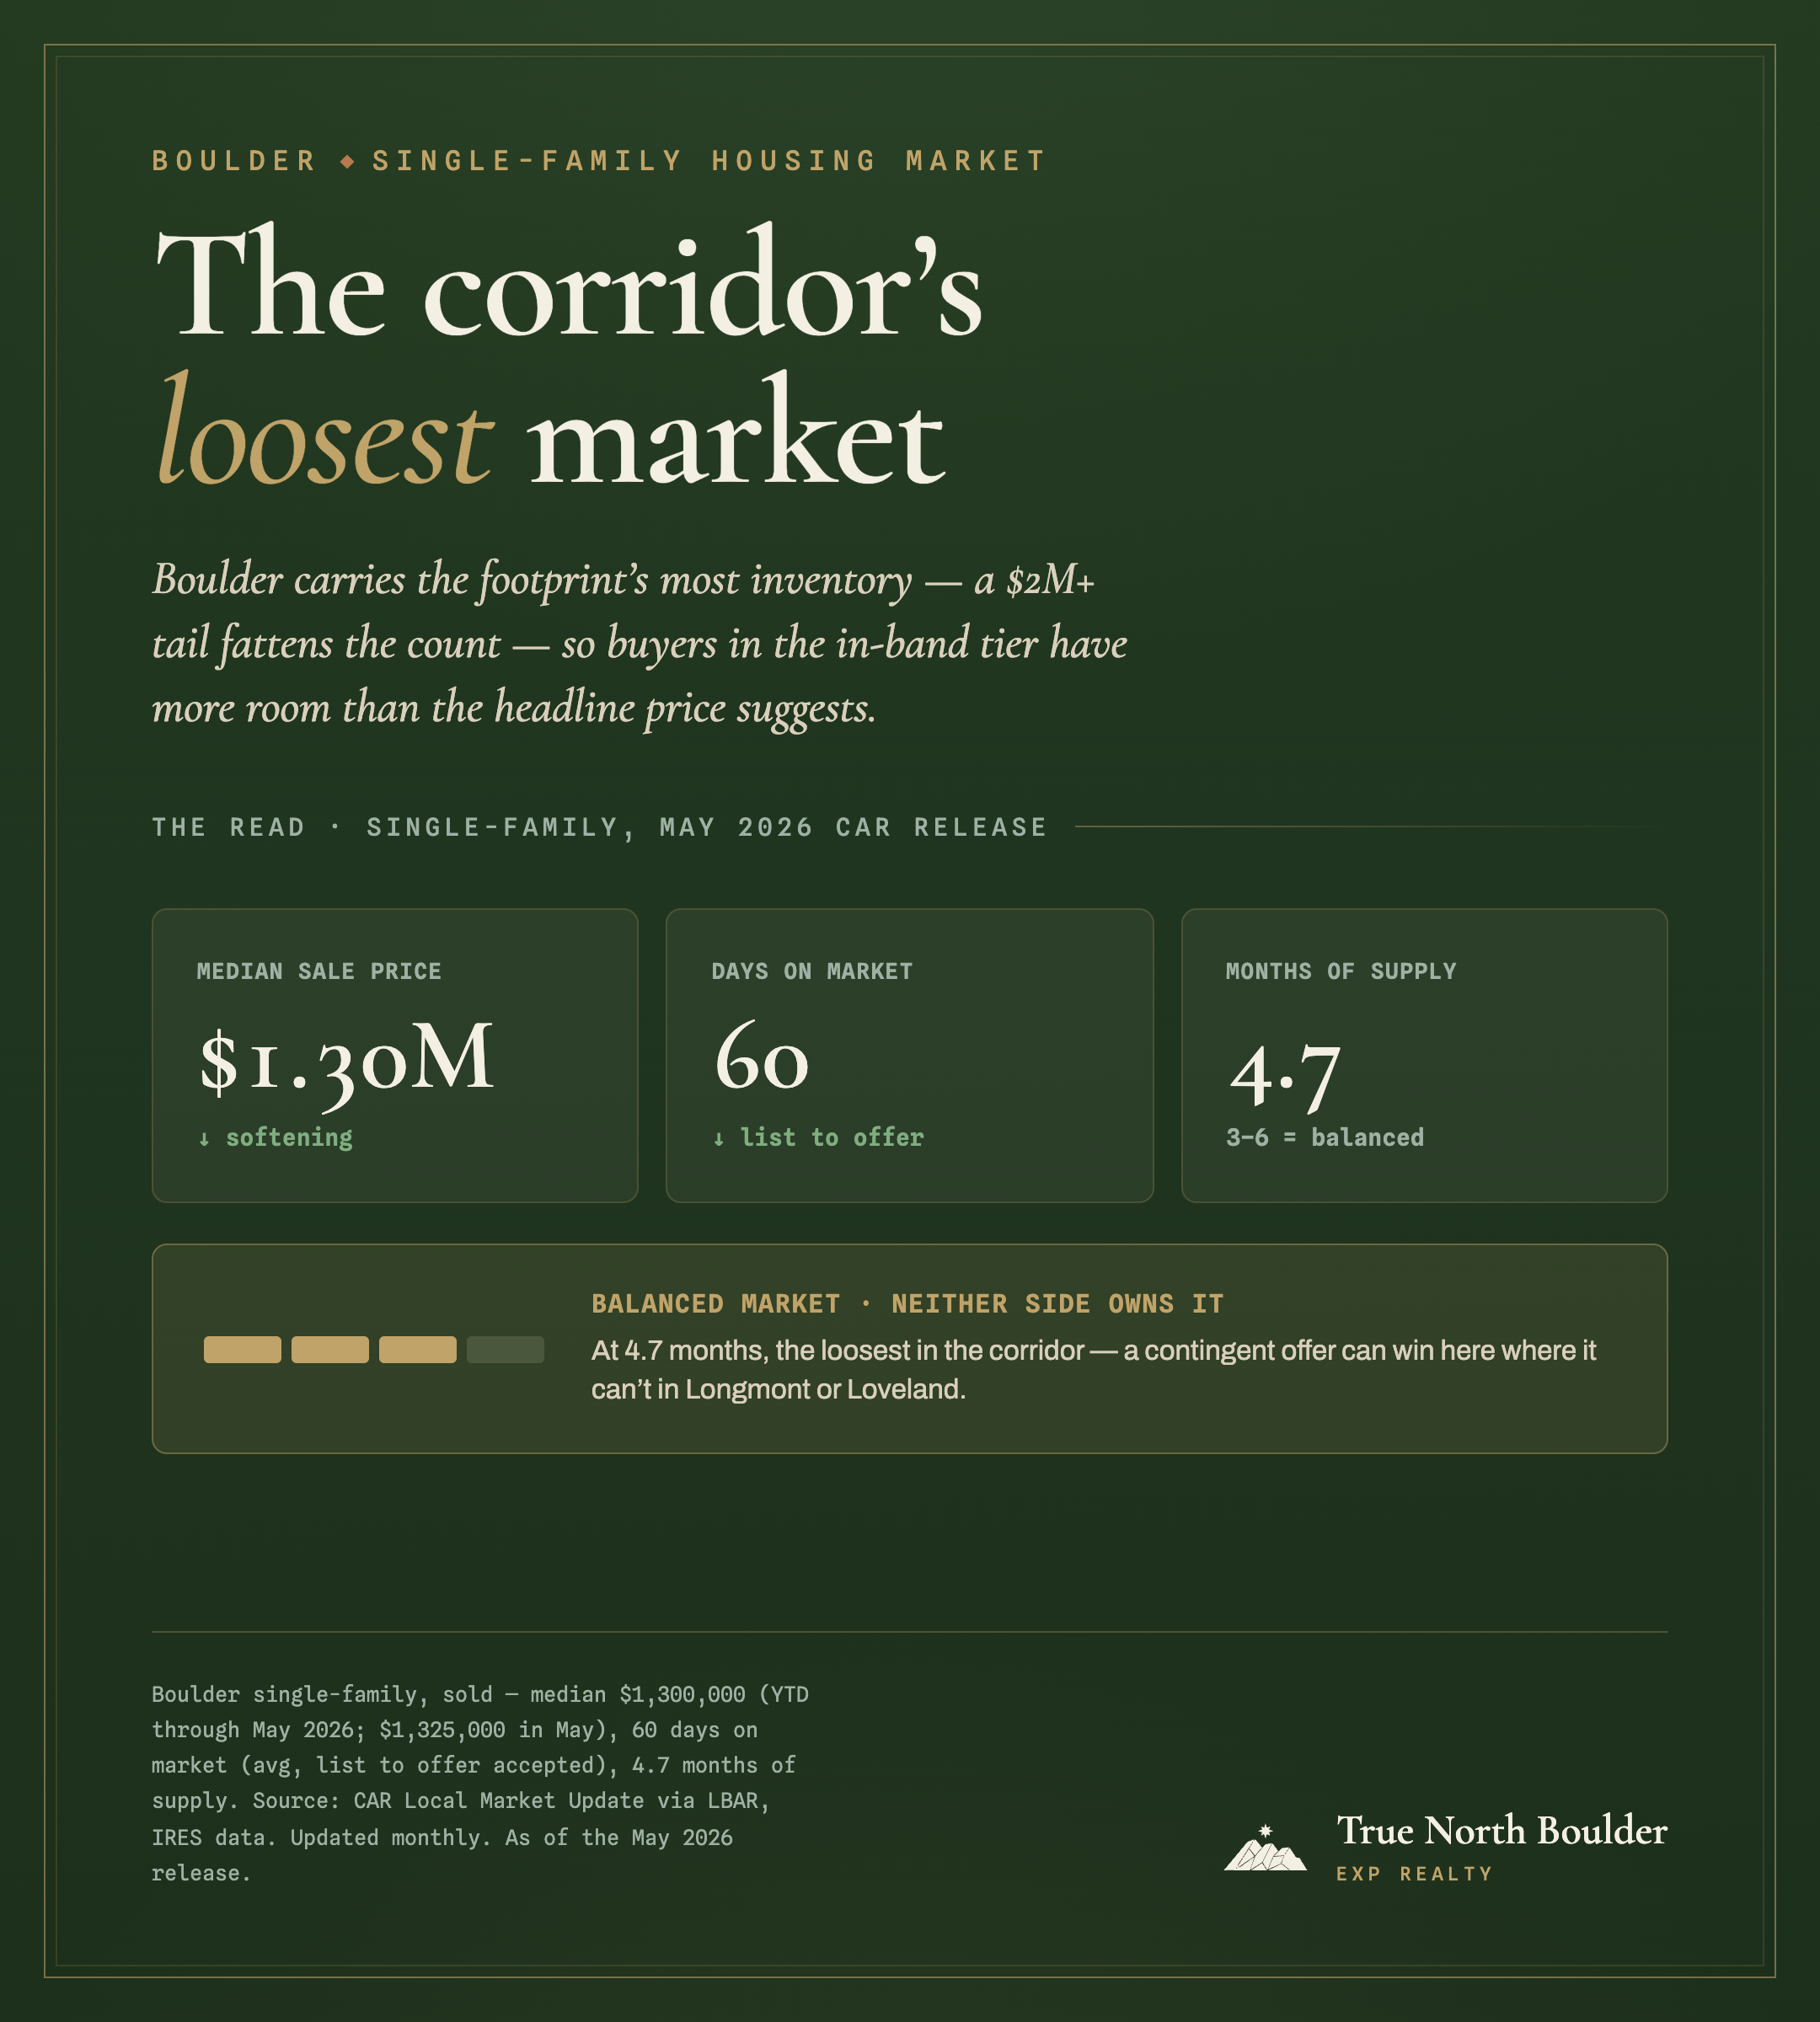
Read those figures the way we compile them: single-family, sold, city of Boulder. And note the one number we deliberately won't publish.
The town median is not your price
Every figure here is single-family, sold, for the city of Boulder, from the Colorado Association of REALTORS Local Market Update, built on IRES MLS data and published free each month. Medians and averages exclude seller concessions.
We won't publish a months-of-supply or median figure for the $800K–$1.5M band. Half of Boulder's single-family sales close above $1,325,000, so the move-up band straddles the median: much of it clears at or below that line, with real competition, while the top of the band sits in the slower, choosier luxury tail above. No public source breaks the band out; it takes a direct IRES pull. If you're transacting in that band, ask us to pull yours, so you're weighing a comp set for your own house instead of a town average that was never about you.
If the median is down, why is supply tightening?
Because they measure different things, and a median measures neither value nor scarcity cleanly. Months of supply tells you how fast the shelf clears at the prices being asked; it fell from 6.4 a year ago to 4.7, so Boulder is clearing faster than it was. The median tells you the middle of what sold, and it's down about 5% year to date, but that moves when the mix of what traded moves, not only when homes change in value.
So here's the line we hold. What's down about 5% is the price of what sold. That is not the same as saying your house is worth 5% less. A town median can't separate a change in value from a change in what happened to trade. The instrument that can is a repeat-sales index, which follows the same homes selling twice; the FHFA publishes one quarterly for the Boulder metro area, and it's the number to watch for value rather than mix.
One structural fact sits under all of this and makes Boulder different from the corridor towns. Boulder adds almost no net-new single-family homes. The city issues permits every year, but construction here is largely scrape-and-replace: a teardown becomes a larger house on the same lot, and the home count barely moves. So the supply that sets price is the existing shelf changing hands, not new building. That's why months of supply, not permit counts, is the number that matters in Boulder, and it's the deeper reason the market can tighten even as the median drifts. We unpack what that does to a move-up trade in the Boulder market and neighborhood hub.
Is Boulder a buyer's or a seller's market?
Closer to balanced, and unusually looser than the corridor towns below it. Boulder single-family supply is 4.7 months, down from 6.4 a year ago. Under roughly three months favors sellers, over six favors buyers, so 4.7 sits in the balanced middle. What surprises people is the direction of the comparison: Boulder is the looser market, and Longmont and Loveland are the tighter ones.
| Single-family, May 2026 | Boulder | Longmont | Loveland |
|---|---|---|---|
| Median sale price | $1,325,000 | $603,500 | $535,000 |
| Months of supply | 4.7 | 2.6 | 2.7 |
| Days on market | 60 | 55 | 61 |
| Median, year to date | $1,300,000 | $600,000 | $525,000 |
Colorado Association of REALTORS Local Market Updates. Data from IRES, single-family, May 2026. Town-level figures, not band-level.
For a move-up buyer, that has a real consequence. The classic corridor trade (sell in Boulder, buy in Longmont or Loveland) now means selling into the looser market and buying into the tighter one, the harder direction. If you're buying in Boulder, though, you have more room than the corridor: at 4.7 months you generally keep your inspection, appraisal, and price leverage, the leverage a sub-three-month market trains out of a buyer. The Boulder vs. Longmont comparison works that trade in detail.
What should move-up buyers and sellers do?
Settle the money before the sign goes in the yard. If you're trading up out of Boulder into the corridor, you're selling into the softer market and buying into the tighter one, so a home-sale contingency rarely wins the home you want. Plan to write non-contingent, which means the funds exist before you write. If a HELOC is part of that plan, open it before you list; lenders generally won't originate a home-equity line on a home that's already on the market. We walk the financing paths in bridge loan vs. sale contingency and the sequencing in the buy-before-you-sell playbook.
If you're the Boulder seller, the number that should concern you isn't the median, it's the calendar and the tier. At 4.7 months your home will very likely sell, but the luxury tail above the median moves slowly and choosily, while sensibly-priced homes below it can still draw competition. Price and prep to your tier, and if you're trading up, remember the softness on your sell side and the tightness on your buy side are the same problem. And whatever you're told, nobody can tell you whether this is the bottom; anyone who says so is guessing with your money.
The honest take
The Boulder number everyone quotes (a $1.3 million median, down about 5%) is doing less work than it looks like it's doing. It's a town-wide, single-family, price-of-what-sold figure, and you are not buying the town. The move-up band straddles it, and the luxury tail above behaves nothing like the middle. What's actually true and useful is smaller and more boring: Boulder clears in about four to five months of supply, faster than a year ago but slower than the corridor, which means a buyer here still has leverage a Longmont buyer has lost, and a seller here still has to justify the price the market no longer hands over. Price to your tier, finance the trade before you list, and treat the headline median as weather, not a valuation. That read shifts month to month, which is why we re-pull it from the CAR/IRES release every month instead of leaning on a quarterly snapshot.
We won't publish a band number. We will build your comp set.
A comp set at your price and your product, not a town average. That is a CMA, and it's the honest answer to what your Boulder home is worth.
Frequently asked
What is the median home price in Boulder?+
Boulder's single-family median sale price was $1,325,000 in May 2026, and $1,300,000 year to date, down about 5% from the same stretch last year (Colorado Association of REALTORS Local Market Update, data from IRES, May 2026). That is the single-family figure. Boulder townhomes and condos are a separate market with a median near $547,000. For a move-up buyer, the important point is that the $800K–$1.5M band straddles the single-family median: much of it sits at or below $1,325,000, with the upper end in the luxury tail above.
Is Boulder a buyer's or a seller's market?+
Closer to balanced, and loosening toward buyers relative to the corridor. Boulder single-family carries 4.7 months of supply, down from 6.4 a year ago (CAR/IRES, May 2026). Under roughly three months favors sellers and over six favors buyers, so 4.7 sits in the balanced middle, notably looser than Longmont (2.6) or Loveland (2.7). A move-up buyer generally has more inspection, appraisal, and price leverage in Boulder than in the tighter corridor towns.
Are Boulder home prices falling?+
Boulder's single-family median is down about 5% year to date, to $1,300,000 (CAR/IRES, May 2026). But a town median measures the price of what sold, which moves when the mix of what traded moves, not only when values change. On a $1.3M market a few high-end or low-end closings swing the median hard. For whether values are actually rising or falling, the honest instrument is a repeat-sales index; the FHFA publishes one quarterly for the Boulder metro area.
Does Boulder build enough new homes to loosen prices?+
Effectively no. Boulder issues building permits every year but adds close to zero net-new single-family homes, because construction here is largely scrape-and-replace: a teardown becomes a bigger house on the same lot, and the home count barely moves. So the supply that matters for price is the existing shelf changing hands, not new construction, which is why 'months of supply' (how fast that shelf clears) is the number to watch here.
How often is this report updated?+
Monthly, at this same URL, with a refreshed last-updated date. The figures come from the Colorado Association of REALTORS Local Market Update for Boulder, built on IRES MLS data and published roughly four weeks after month end.
Sources & data notes
- All Boulder, Longmont and Loveland figures: Colorado Association of REALTORS Local Market Update, single-family, sold, May 2026 (and year-to-date through May), published free each month via the Loveland-Berthoud Association of REALTORS, built on IRES MLS data. Boulder · Longmont · Loveland. Boulder: median $1,325,000 (month) / $1,300,000 YTD; average $1,592,974; 60 days; 4.7 months of supply (from 6.4); 86 sales in May; 98.6% of last list price.
- Basis matters. These are single-family figures. Boulder townhome/condo is a separate market (median about $547,000) and any blended "Boulder median" mixes the two. Medians, averages, and percent-of-list exclude seller concessions.
- "Percent of list price received" is measured against the last list price, after any reductions, not the original. It is not evidence that prices are holding.
- Days on market is an average from listing to accepted offer, not to closing. Months of supply is inventory divided by trailing-twelve-month average pending sales (ShowingTime, which generates the report); 3–6 is conventionally read as balanced.
- Single-month figures are noisy (86 Boulder single-family sales in May); we lead with year-to-date.
- Net-new supply. Boulder issues building permits annually but adds close to zero net-new single-family homes because construction is largely scrape-and-replace; the price-relevant supply is the existing stock changing hands.
- What we do not publish: a months-of-supply or median figure for the $800K–$1.5M band. No public source breaks it out; a direct IRES broker pull is required. So we label the town figure honestly and refuse to invent a band figure.
- A repeat-sales index (which tracks the same homes selling twice and so controls for changes in what sold) separates value from mix. The FHFA House Price Index publishes one quarterly for the Boulder metro area.
Get the monthly Boulder read.
Real MLS numbers, and the basis they're actually measured on, about once a month. Unsubscribe any time; see our privacy policy.
See also: the Boulder market and neighborhood hub · the buy-before-you-sell playbook · bridge loan vs. sale contingency · the Boulder vs. Longmont comparison. External: CAR Local Market Update — Boulder (IRES data) · Boulder County Assessor.
Daniel Hsieh is a licensed Colorado real estate broker with True North Boulder, brokered by eXp Realty. Market figures are month-old MLS data and are not a valuation of any specific home; verify any number against current IRES or county data before acting. This report is general market information, not lending, tax, or legal advice: confirm your specifics with your lender, CPA, or attorney.